Why insurance companies need internal capital models
Anubhav Chattoraj, Founder & Director · 11 June 2026 · 13 min read
Globally, capital modelling is one of the major verticals of actuarial work along with verticals like pricing and reserving. To my knowledge, however, the capital modelling vertical does not exist in Asia. This article is therefore intended as a brief primer about what capital models are and why insurance companies need them, for companies and actuaries who may not be very familiar with the concept.
I use “capital model”, “internal model”, and “internal capital model” interchangeably in this article.
Why does an insurance company need a capital model?
Internal capital models are not (primarily) about capital. They are about giving companies visibility into their exposure to tail events.
Consider a typical Asian insurance company that produces a business plan of what the next year is going to look like: what kind of claims the company is going to get on different lines of business, how much of those claims can be recovered from reinsurers, how much investment income the company is going to earn, and so on. Factoring everything in, the business plan predicts an expected profit of $500 million.
However, that $500 million number is just one estimate of an uncertain future. The actual future might look quite different. For instance, if the company writes health insurance and there’s an unexpected global pandemic, or if the company writes long-term interest guarantees on its life insurance policies and the market interest rates crash, or the company writes property insurance and a magnitude 9 earthquake destroys multiple cities, it will see a loss that’s much bigger than the profit it was planning to make. These potential loss scenarios need to be visible to the company so it can try to plan around them instead of stumbling into them unprepared.
Ideally, what the business plan should include along with the $500 million profit figure (which can be considered a mean) is a statistical distribution of the company’s P&L result. This could be in the form of a table like this:
| Percentile | P&L Loss |
|---|---|
| 50% | -719 |
| 55% | -647 |
| 60% | -567 |
| 65% | -476 |
| 70% | -371 |
| 75% | -245 |
| 80% | -89 |
| 85% | 119 |
| 90% | 423 |
| 95% | 983 |
| 96% | 1,175 |
| 97% | 1,431 |
| 98% | 1,811 |
| 99% | 2,510 |
(The negative numbers are profits and the positive numbers are losses. The signs are set up this way because from a risk management point of view, we want to be focusing on the potential for loss, which, in insurance, is usually much more than the potential for profit.)
This table says that there’s a 50% chance the company’s losses will be less than negative $719 million (i.e., that profits will exceed $719 million; the $719 million profit is therefore the median financial outcome.) There’s an 85% chance the company’s losses will be less than $119 million. There’s a 99% chance the company’s losses will be less than $2,510 million.
In other words, there’s a 1% chance the company will have made a loss of more than $2,510 million at the end of the year, which is a very different result from the $500 million profit that was planned.
Equivalently, this data can be represented as a bell curve showing the probability of different P&L results:
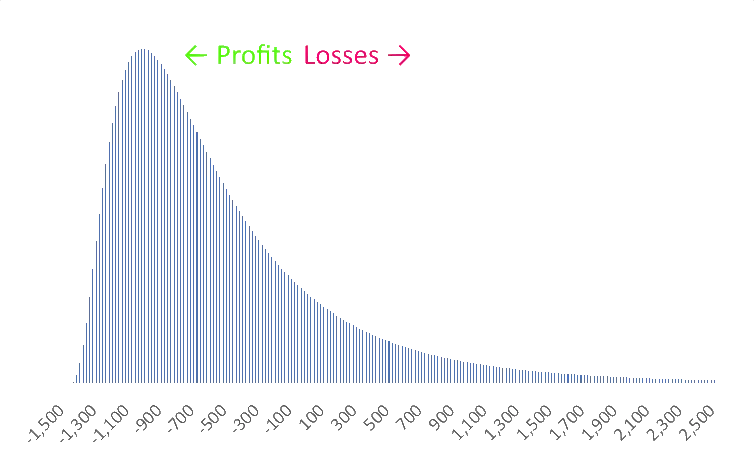
(Remember, we’re showing profits as negative and losses as positive.)
The graph is skewed; the right tail of potential losses extends much further than the left tail of potential profits. (This is why the median profit of $719 million is higher than the mean profit of $500 million. The long tail of increasingly large loss results drags down the mean profit.)
An internal capital model is nothing but a piece of software that produces numbers, tables, and graphs like the ones above. In other words, a company’s internal capital model is a stochastic version of its business plan.
It follows that a capital model needs to be as granular as the business plan itself. A model that predicts there’s a 5% chance of the company posting a loss higher than $983 million isn’t very helpful, unless that model can also be used to understand how to reduce that chance - be it better underwriting, better hedging, better reinsurance, or something else.
What goes into a capital model?
Generally, internal models simulate 4 classes of risk that an insurance company is exposed to:
- Insurance risk - risk of claims payouts being more than expected
- Market risk - risk of adverse market movements, e.g. in interest rates or equities
- Credit risk - risk of debtors defaulting (including risk of reinsurers defaulting on claims payments owed)
- Operational risk - risk of losses from people or process failures within the company
Usually, for a general insurance company, insurance risk is the most material risk class, while for a life insurance company it is market risk.
From a modelling standpoint, there needs to be a lot of granularity even within these risk classes. Within insurance risk, for instance, two classes of business (e.g. fire & motor) might move quite differently. Within market risk, property and equity markets might move differently. However, there will usually be some correlation between different classes and between different risk areas; e.g. a recession might affect both market movements and insurance claims.
As such, for every item that’s being modelled separately, it’s necessary to give the model a statistical distribution along with the associated parameters (usually a mean and standard deviation). It’s also necessary to give the model the correlation factors between different items. The process of estimating these distribution parameters, correlation factors, etc. is called “parametrization”; the parametrization process uses historical data and / or benchmarks with a healthy sprinkling of actuarial judgement.
Further, to be a realistic view of how different scenarios would affect the company, all the risk mitigation strategies of the company (e.g. reinsurance, hedging, and so on) need to be coded into the model. These arrangements may be quite complex and trigger based on a combination of several different modelled items (e.g. consider a stop loss corridor over multiple lines of business).
Based on the parameters fed in, the model runs a large number of simulations (100,000 seems to be the market standard in the UK) of what the next year is going to look like for the company.
What outputs does a capital model produce?
A capital model is a very complex piece of enterprise software, and parametrizing, updating, and running it takes a lot of actuarial and computational time (not to mention disk space; 100,000 detailed business plans take up a lot of storage).
But, in exchange for all these resources, what the model produces is incredibly powerful: from the simulations, you can pull out tables and graphs like the ones I showed above - e.g. if, in 50% of the simulations the financial result is better than $719 million, and in 50% of the simulations it’s worse, this is equivalent to saying that a $719 million profit is the 50th-percentile value.
More importantly, the model can be used to understand how changing any aspect of the company’s business - be it the business mix, the reinsurance strategy, the hedging strategy, or anything else - changes the probability distribution of the financial results. The model can therefore be used to make business decisions across practically any area of the company. For instance, you can run a number of possible reinsurance programmes through the model, pick the output distribution you like best, and implement the corresponding reinsurance programme.
Some obvious questions arise:
Question: Couldn’t I have made business decisions with just the business plan? Preparing it every year is a huge effort, do I really need to put in 10x the effort to set up and run a capital model?
Answer: The business plan focuses on the mean while the internal model focuses on the tail, and the tail is where risks come from. It makes no sense to think of risk mitigation strategies based only on the mean impact; risk mitigation should be about ceding away profits at the mean for protection in the tail.
Question: Yes, but I can run some scenarios around the business plan to understand the tail impact.
Answer: 100,000 simulations coming out of a rigorously parametrized model give you a much wider field of view than a handful of scenarios plucked out of thin air. For instance, suppose scenario assessment shows that reinsurance protects 10% of profit in a particular scenario. Very well. But does the company’s management know if that scenario is a 75th percentile scenario or a 99th percentile scenario? Suppose the company is ceding away 40% of its mean profit on reinsurance which becomes profitable only beyond the 95th percentile. Is that an acceptable outcome for the company? Possibly, or possibly not. It depends on the company’s risk appetite. But without a capital model, management can’t even see that the reinsurance is only profitable beyond the 95th percentile, and cannot meaningfully assess the trade-offs involved.
Once the distribution exists, it can be used to assess capital adequacy.
How does this tie into capital?
A company can use its internal model to arrive at a capital requirement for itself. Regulators want insurance companies to have enough capital to survive even extreme scenarios; a common target across several markets is 99.5th percentile, i.e., an insurance company should have at most a 0.5% chance of collapsing over the next year.
This is straightforward to demonstrate if the company has taken the trouble of building out an internal model. For example, returning to the percentile table above: the 99.5th percentile is a $3,280 million loss. So the company needs to have enough assets for its capital model to say that it’ll have some cash left over even if it gets hit with that $3,280 million loss. (If the company doesn’t have enough assets, it needs to reduce its risk so the 99.5th percentile loss goes down.)
In several developed economies, insurance regulators do accept this reasoning; if a company has already built an internal capital model, regulators allow the model to be used to demonstrate the company’s capital adequacy. But, crucially, the company should be using the model for business decisions too; a model created just to demonstrate capital adequacy would be quite open to misuse, so (to my knowledge) regulators don’t allow it.
Internal models are optional in most jurisdictions that recognize them; a company may decide for itself whether or not it wants to take the effort of implementing one. However, Lloyd’s has made internal models mandatory; every Lloyd’s syndicate must set up an internal capital model within a few years of starting up. I find this unsurprising; as I said above, an insurance company can’t have an adequate view of its tail risks without its internal model. This significantly impacts the company’s risk management.
However, a lack of resources prevents other jurisdictions from making such models mandatory.
How can an internal model be trusted?
What leads to the model being trusted (both by stakeholders within the company and by regulators) is that there’s a robust process of validation and governance built around it.
(The following is based on my experience with the UK market, but I understand other markets that allow internal models would have similar practices.)
The model needs to be approved by the regulator before it can be used for regulatory capital adequacy calculations. If re-parametrization causes the capital requirement to change beyond a certain threshold, the regulatory model approval process gets triggered again.
Before the regulatory approval, and periodically after the approval, there is an exhaustive validation process by an independent actuarial team (this team is typically part of the same company’s Risk vertical, or it can be from a consulting firm). This validation covers every aspect of the model, and typically includes back-testing, sensitivity testing, data reconciliations & input/output checks, reviews of methodology & actuarial judgement, and so on.
Some consulting firms run anonymized benchmarking exercises across the insurance industry; their reports can help insurance companies understand how the parameters they’ve selected for their model differ from those being used in the wider industry (or rather, in the section of the industry that agreed to be part of the benchmarking exercise).
Every insurance company that uses a capital model has internal model governance committees with stakeholders from multiple verticals (typically capital, pricing/reserving, risk, reinsurance, catastrophe, underwriting, asset management, and so on). Every change made to a model (including data updates) is presented to and signed off by these committees, who are expected to challenge these changes when needed.
None of these tests are absolute, of course. Back-testing, for instance, may fail if the characteristics of the business being written have changed materially over time. Benchmarking may highlight parameters significantly different from the rest of the industry, but that might be because the company’s business mix under a modelling class differs materially from other companies’ business mixes. The important bit is that such deviations are recorded and justified, and the company’s capital team, its governance committees, and the regulator are all aware of them. No one is flying blind.
The Asian situation
At present, to my knowledge, no jurisdiction in Asia allows internal capital models to be used to set regulatory capital requirements.
In India, my home base, the actuarial talent required for model development, parametrization, and validation is not available in sufficient density, and much of the market can’t afford the costs (personnel costs, audit costs, software costs…) associated with capital models. Further, non-actuarial senior management’s/Boards’ understanding of risks and risk management is, in my opinion, largely not of a standard that would enable them to meaningfully challenge capital model parameters or outputs.
Possibly, some or all of the same constraints apply even in the developed Asian markets (e.g. China, Singapore, UAE, Japan, South Korea) since none of them have permitted the use of internal models.
Instead, all major Asian markets1 have a “Risk-Based Capital” (RBC) regime, which is equivalent to a Standard Formula approach under European Solvency II. Effectively, it is a simplified market-level version of an internal capital model, which requires the regulator to carry out a market-level parameterization instead of requiring insurance companies to calculate parameters specific to their experience.
The way forward for Asia
Regulatory acceptance of internal capital models in the US and Europe has followed, rather than preceded, the creation and use of such models by major insurance companies.
I’ve tried to make the case above that it’s worth putting in the effort to develop an internal capital model to better understand and manage tail risks. As insurance companies in Asia start developing, using, and becoming comfortable with these models for business planning and risk mitigation, we may see regulatory openness with regard to using such models to set capital requirements. This would, in turn, drive wider adoption of internal models, improving risk management in the insurance sector as a whole.
Originally posted on LinkedIn, published here with minor changes.
Footnotes
-
The sole exception being India, where the local RBC framework is under testing but expected to go live soon. ↩
In this article